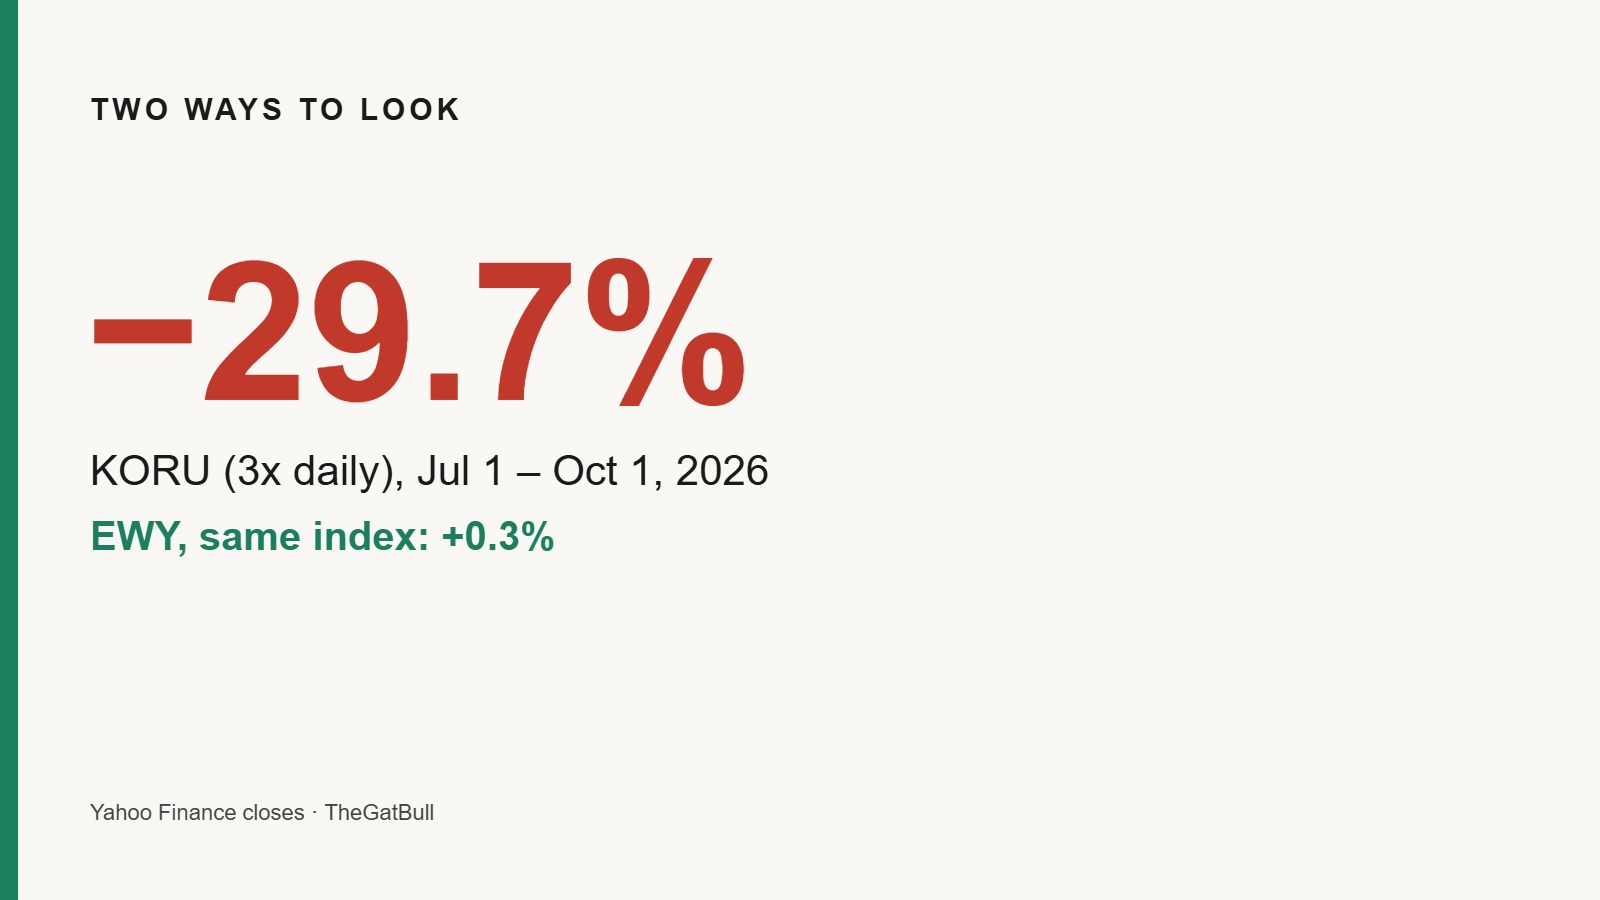
TL;DR — If you hold EWY. EWY is roughly where it was on July 1 (+0.3%, though still down 7.8% from June 30), but KORU, which tracks the same index at three times the daily move, is down 29.7%. Your EWY is not a milder version of a 3x fund; it is a product with a different clock, and about $1.69 billion left EWY in September (etfdb).
US closing prices in dollars. Not financial advice; leveraged ETFs can lose value quickly. Data notes are at the end.
If the index is flat, why is the 3x fund down 30%?
Because KORU’s target is not “three times the index.” It is three times the index’s move each day. Direxion says so directly: the fund seeks daily results, before fees and expenses, of 300% of the performance of the MSCI Korea 25/50 Index, and it “should not be expected to provide three times the return of the benchmark’s cumulative return for periods greater than a day.” Because the 3x resets every day, a market that swings hard can return to where it started while the 3x fund does not.
The short answer
From the July 1 close to the October 1 close, 2026 (US closes, dollars, not dividend-adjusted), EWY went from $185.50 to $186.11, up 0.33%, and KORU went from $30.00 to $21.09, down 29.70%. Both track the MSCI Korea 25/50 Index. Simply multiplying EWY by three would give +0.99%. The gap comes from how hard the Korean market swung over those three months, and from a structure that multiplies each day’s swing by three, regardless of where the index ends up.
A note on the start date. July 1 was a day EWY fell 8.1%, so this window begins right after that drop. Start on June 30 instead and the conclusion is the same: EWY −7.8%, KORU −46.0% (table below).
If you hold EWY. SK Hynix (23.72%) and Samsung Electronics (22.77%) together were 46.49% of EWY (iShares, as of September 30, 2026), so their day largely sets EWY’s day, and KORU multiplies that day by three. EWY is built to be held; Direxion designs KORU for short-term trading. They are not stronger and weaker versions of the same bet.
1. Same index, different promises
| Item | EWY | KORU |
|---|---|---|
| Objective | Track MSCI Korea 25/50 (1x) | 300% of the index’s daily performance |
| Expense ratio | 0.59% (iShares) | 1.32% (Direxion) |
| Assets (etfdb, updated Oct 1) | $26.69B | $1.43B |
Sources: iShares and Direxion product pages; etfdb profiles. Excluding acquired fund fees, KORU’s net expense ratio would be 0.95% (Direxion). KORU’s assets are about 5% of EWY’s.
2. Three months in numbers: same period, different outcomes
| Period (US closes) | EWY | KORU | EWY × 3 (simple) |
|---|---|---|---|
| Jun 1 → Oct 1 | −14.12% | −66.65% | −42.35% |
| Jun 30 → Oct 1 | −7.82% | −46.02% | −23.46% |
| Jul 1 → Oct 1 | +0.33% | −29.70% | +0.99% |
| Aug 14 → Oct 1 | +3.54% | −2.36% | +10.63% |
| Sep 17 → Oct 1 | +2.04% | +3.33% | +6.12% |
Our calculation from Yahoo Finance closes, in dollars, not dividend-adjusted. “EWY × 3” is the period return times three.
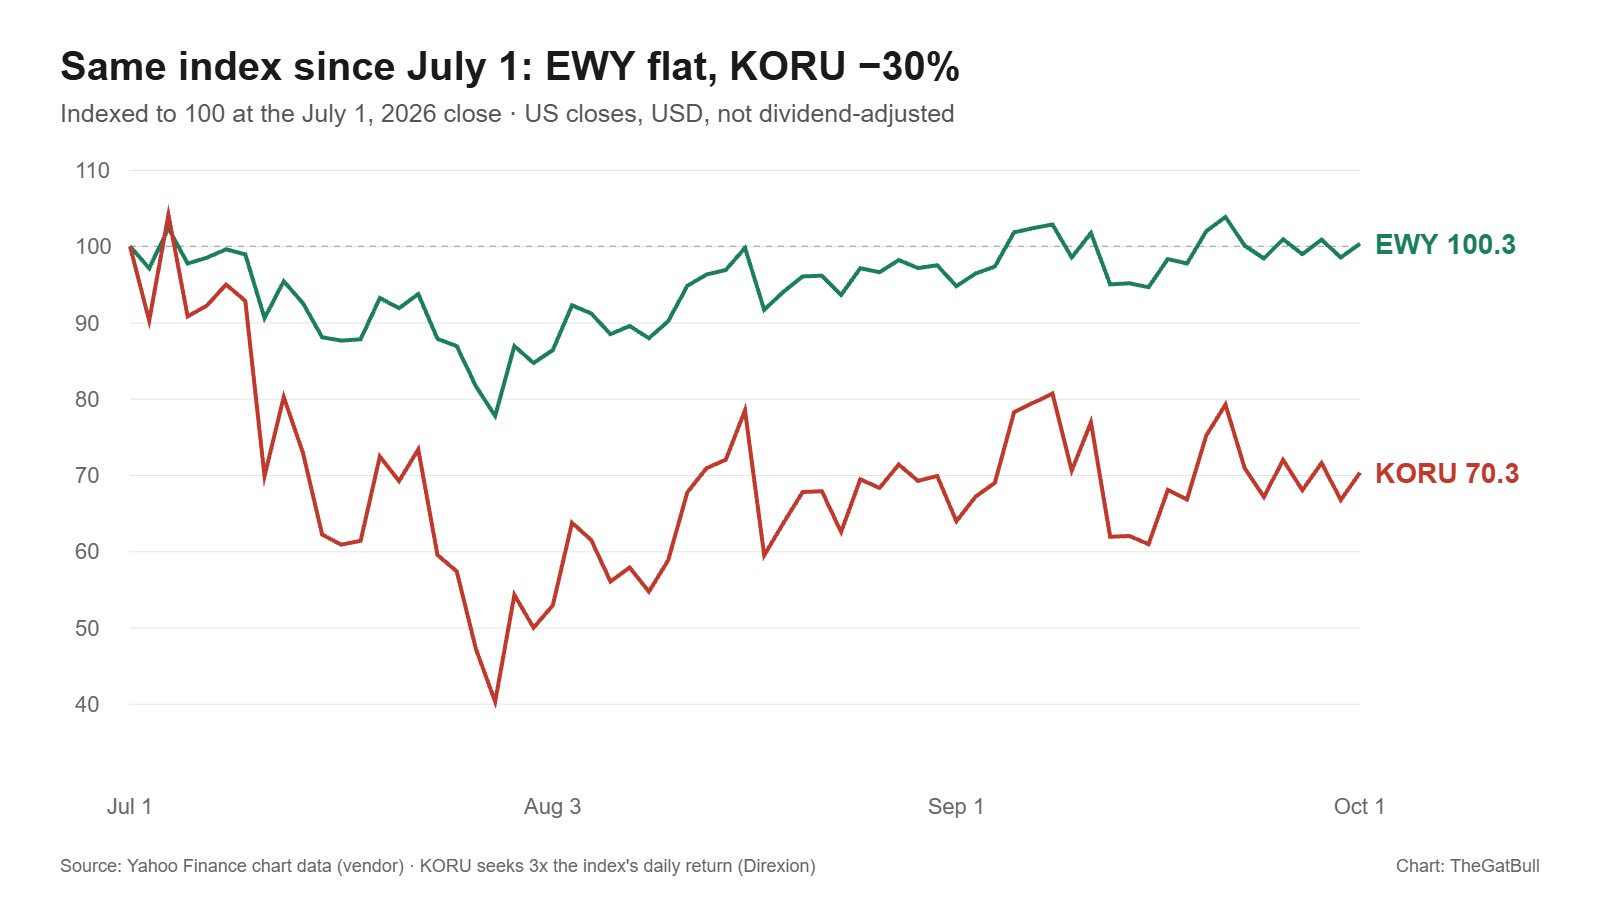
Two things stand out. First, even in a window where EWY rose (Aug 14 → Oct 1, +3.5%), KORU fell 2.4%. Second, in a quieter rising window like Sep 17 → Oct 1, KORU did rise, but by 3.3%, short of three times EWY’s move (6.1%). Daily reset effects come from the path, not the direction.
Here is the simplest version. If a 1x fund gains 10% one day and loses 10% the next, you have 1.10 × 0.90 = 0.99, a 1% loss. A 3x fund over the same two days has 1.30 × 0.70 = 0.91, a 9% loss. The bigger the swings, the bigger the gap. Compounding three times EWY’s actual daily returns from July 1 to October 1, before fees and financing costs, gives −22.62% (our replication, not Direxion’s NAV). KORU’s actual result was −29.70%. The remaining roughly 7 points presumably came from costs, financing and tracking differences, but we could not break that down — not confirmed. What the replication does show: with fees and financing costs excluded, a 3x fund would have lost 22.6% over this stretch.
3. Why the effect is so large in Korea
Since June, EWY (priced in dollars, so including won moves) has moved a lot in a single day. From the June 1 close to October 1, EWY moved 5% or more on 18 of 85 US trading days (10 up, 8 down, including 4 days of 10% or more). In the roughly eight months before that (October 2, 2025, to May 29, 2026, 164 trading days), it did so 18 times. The same count, packed into about half the time. Of the 85 trading days since June 1, EWY’s biggest moves were June 5 (EWY −14.1%, KORU −41.9%) and June 23 (EWY −12.2%, KORU −35.7%). KOSPI itself went from its one-year closing high of 9,114.55 on June 22 to 7,003.74 on October 2, down 23.2% (Seoul closes; a separate market, not paired day by day with EWY).
We did not confirm the causes of these drops. The structure, though, is visible. Nearly half of EWY is two stocks, Samsung Electronics and SK Hynix, so one industry’s day easily becomes the index’s day, and a 3x fund holds that day multiplied. The same daily-reset structure applies to any daily-reset 3x ETF; in the US, TQQQ is the familiar example (etfdb, Oct 1: expense ratio 0.78%, assets $37.5B, year to date +48.87%). Not a perfect parallel — the index and the volatility regime are different, and a single year-to-date figure cannot show path dependence. What we take from it, and no more: the structure is the same, and the result depends on how much the underlying market swings.
4. Where did the money go? (etfdb fund flows)
| Period (ending Sep 30) | EWY net flow | KORU net flow |
|---|---|---|
| Mar 30 – Jun 30 | −$1.82B (derived) | −$2.94B (derived) |
| Jun 30 – Aug 30 | +$5.18B (derived) | +$0.58B (derived) |
| Aug 30 – Sep 30 | −$1.69B | −$0.17B |
From etfdb’s one-, three- and six-month range totals; “derived” rows subtract one total from another and assume the boundaries line up.
What the data shows: in September about $1.69B (roughly 6% of assets as of Oct 1) left EWY, and about $0.17B (roughly 12%) left KORU. In July and August, by contrast, about $5.18B (derived) came into EWY. Over roughly the same stretch, EWY’s price went from $201.90 on June 30 to $180.20 on August 28 (−10.75%), then rose 1.43% from August 28 to September 30. Money came in as the price fell and went out as it edged up 1.4%. Whether that was dip buying, profit-taking or rebalancing, this data cannot tell us; it is an observation, not a confirmed finding. We also do not call July a “record inflow,” because we could not check monthly records.
5. Two ways to look
The KORU view. KORU was built as a short-term tactical tool. Direxion itself says not to expect three times the return beyond a day. In a volatile market, a correct call on direction over a short window can pay well — and there were windows like Sep 17 → Oct 1 where KORU did beat EWY (+3.3% vs. +2.0%). From this view, a large loss over three months is a known risk the fund discloses, not a malfunction.
The EWY view. For someone who wants to own Korea, EWY’s +0.3% is not “three quiet months.” It is a path that went through a drop of more than 8% and came back to the start. Someone who rode that path at three times the daily move is standing at −30%, not at the start. From this view, KORU’s −29.7% shows how far a 3x daily-reset holder can end up from an ordinary holder of the same index over three months — the gap comes with how long you hold.
Neither view conflicts with the facts. What does conflict with the facts is a common intuition: that “KORU goes up three times as much as EWY.”
6. What this tells you about the Korean market
This is the fact about the Korean market you only see by looking at these two funds together: daily swings in Korea’s large-cap market, as EWY shows them in dollars, are now big enough that a 3x daily-reset structure can lose 30% on top of an index that ends up flat. Since June 1, EWY moved 5% or more on about 21% of trading days. When a US reader says “I’m investing in Korea at 3x,” what they are actually buying is not three times the index but three times each day’s move, and Korea has recently been a market where that day is very large (we did not compare it with other markets). The gap is invisible until you put the two funds side by side and compare them over the same dates.
7. How to access them
- EWY: bought like any ETF in a US brokerage account (NYSE Arca, expense ratio 0.59%). Top holdings SK Hynix and Samsung Electronics, 46.49% combined (iShares, Sep 30).
- KORU: a leveraged ETF in the same account (NYSE Arca, expense ratio 1.32%). Designed for short-term trading, not long holding periods (Direxion).
8. What to watch
- Seoul is closed Monday, October 5 (substitute holiday for National Foundation Day) and Friday, October 9 (Hangul Day), per the KRX calendar: EWY and KORU keep trading in New York while Seoul is shut — the structure we covered in what EWY does when Korea is closed. Watch how the Seoul gap around those holidays gets multiplied in a 3x fund.
- Monthly etfdb flows: whether EWY’s outflows continue in October, and which way KORU’s $1.43B in assets moves.
- Volatility: whether 5%-plus days keep running at about 21% of trading days.

Under the Gat. When Korea rallies, it’s tempting to want three times the gain. But what KORU buys is not three times Korea; it’s three times Korea’s day. In a market that swings and reverses, those are different things. Why EWY is flat since July 1 while KORU is down 30%, in one line: the index walked back; the 3x fund ran back and fell. A view, not advice.
The conclusion
- Two funds on the same MSCI Korea 25/50 Index split to +0.3% and −29.7% from July 1 to October 1.
- The cause is the path, not the direction, and Korea’s recent path has been very rough.
- Money flowed into EWY while its price fell and left again in September; the data does not say why.
More on EWY’s structure: Korea’s ETF premium rule vs. EWY · how EWY’s holdings changed after MSCI’s August review.
FAQ
Is KORU an ETF that returns three times EWY?
No. Its objective is 300% of the daily performance of the MSCI Korea 25/50 Index, and Direxion states that it should not be expected to deliver three times the index’s cumulative return over periods longer than a day.
Why was KORU down 29.7% when the index was flat?
From July 1 to October 1, 2026, EWY rose 0.33% and KORU fell 29.70% (US closes). Compounding three times EWY’s daily returns alone, before fees, gives −22.62% by our calculation. We could not break down the rest, which would include costs, financing and tracking differences.
How often has EWY moved 5% or more in a day since June?
From the June 1 close to October 1, 2026, EWY moved 5% or more on 18 of 85 trading days (10 up, 8 down). In the roughly eight months before that, it did so on 18 of 164 trading days. We did not confirm the causes.
How much money left EWY in September?
About $1.69 billion from August 30 to September 30, by etfdb’s fund-flow figures, roughly 6% of the fund’s assets. KORU saw about $166 million leave. An inflow of about $5.18 billion in July and August is derived by subtracting etfdb’s one-month total from its three-month total.
Where can I buy EWY and KORU?
Both are ETFs listed on NYSE Arca and can be bought in an ordinary US brokerage account. KORU is designed as a short-term trading tool.
Sources
KORU objective, warning, expenses: Direxion KORU product page (checked Oct 2, 2026) · Fund flows, assets, TQQQ figures: etfdb KORU · etfdb EWY (updated Oct 1; flows ending Sep 30) · EWY expense ratio and holdings: iShares, holdings as of Sep 30, 2026 · Prices: Yahoo Finance chart data for EWY, KORU, ^KS11 (vendor data)
Confidence
| Item | Strength |
|---|---|
| KORU objective and multi-day warning | [primary] — Direxion |
| EWY/KORU returns, 5%-plus day counts, 3x replication | [measured] — our calculation from vendor closing prices |
| Fund flows (one-, three-, six-month) | [reported] — etfdb; “derived” rows assume aligned boundaries |
| EWY expense ratio and top-two weights | [primary] — iShares, as of Sep 30, 2026 |
| Causes of the June drops · breakdown of KORU’s 7-point gap · reasons for flows | not confirmed |
Data notes: EWY and KORU figures are US closing prices from Yahoo Finance chart data (vendor data, not the exchange’s own record), not adjusted for dividends. KOSPI figures are Seoul closes and are not paired with US trading days.
This article is for informational purposes only and is not investment advice. Leveraged and inverse ETFs are complex, can lose value rapidly, and are generally intended for short holding periods. Figures are as of the dates shown. Do your own research.
 Written by Mr.Gat — TheGatBull
Korean market coverage from a Seoul-metro-based operator who reads the filings in the original language. Every price on this site is the KRX regular-session close (15:30 Seoul); every figure states whether it came from a primary filing, the press, or our own calculation. Drafts are AI-assisted, then verified against the original Korean documents and edited by a human before publishing.
Found an error? Tell us — corrections get priority. How we work →