Not financial advice. TheGatBull does not provide investment advice.
Kia posted record second-quarter revenue. Operating profit fell anyway. US tariffs sat in between — and what is left is a carmaker trading at 6.8x earnings.
The short answer
Year to date through September 14, the KOSPI is up 58.62%. Over the same window, Kia is up 1.97%.
Same exchange, same closing basis, same start date (December 30, 2025), same currency. This is not an FX illusion or a cherry-picked date range.
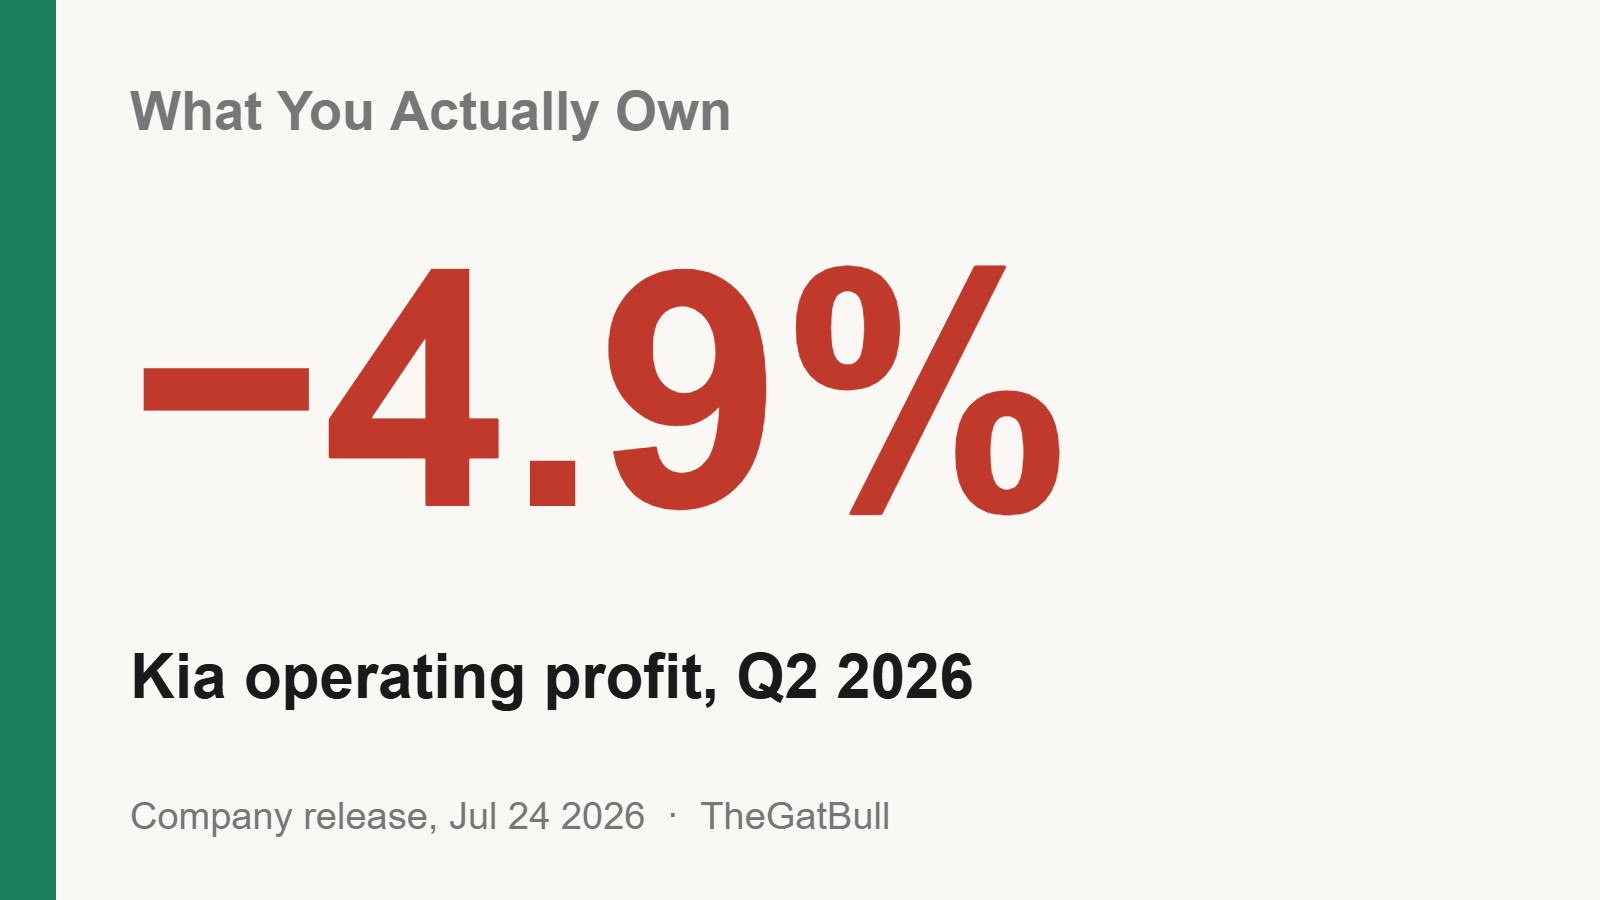
So look at what the company itself reported. Second-quarter revenue: ₩33.037 trillion (about $24.5bn) — a quarterly record, up 12.6%. Second-quarter operating profit: ₩2.6285 trillion (about $1.95bn) — down 4.9%.
Revenue grew by roughly ₩3.7 trillion and operating profit still shrank. None of the new revenue reached the profit line. This piece is about what sits in between.
The one-paragraph version
Kia sold more cars, at higher prices, than ever. Then US tariffs took ₩783 billion (about $582m) in the first half and incentives took another ₩723 billion. Operating margin fell to 8.0%, down 1.4 points. The stock is up 2% this year. What is left is a carmaker trading at roughly 6.8x earnings with a ~5.5% dividend yield — and a 1.08% slice of the ETF most Americans use to “buy Korea.”
1. What happened in Seoul today
All Korean figures are 3:30 PM KST closes on the KRX, Korea’s main exchange. Won-to-dollar conversions throughout this article use one basis: ₩1,345.9 (Seoul close, September 11). The September 14 rate was not obtained.
| Instrument | Sept 11 | Sept 14 | Day |
|---|---|---|---|
| KOSPI | 6,909.91 | 6,684.37 | −3.26% (−225.54p) |
| KOSDAQ | 820.64 | 806.79 | −1.69% |
| Kia (000270) | ₩126,600 | ₩124,200 | −1.90% |
| Hyundai Motor (005380) | ₩382,500 | ₩371,500 | −2.88% |
Kia closed at ₩124,200 (about $92.28) and fell less than the index. Its intraday low was ₩122,000 (−3.63%), and the close recovered from there. Intraday prints do not mix into the closing-basis numbers above.
⚠️ Why the market fell today, we did not confirm from a primary source — so this piece does not assign a cause. What is a published calendar fact: the Fed’s FOMC meets September 15–16.
One day is not the story. The year is. And Kia’s year was decided on the income statement, not the tape.
2. Record revenue, smaller profit
Kia released its second-quarter results on July 24, 2026 (consolidated basis).
| Q2 2026 | Figure | YoY |
|---|---|---|
| Revenue | ₩33.037tn (~$24.5bn) | +12.6% — quarterly record |
| Operating profit | ₩2.6285tn (~$1.95bn) | −4.9% |
| Operating margin | 8.0% | −1.4 points |
| Net profit | ₩2.3278tn (~$1.73bn) | +2.6% |
| Global wholesale units | 851,639 | +4.5% |
| Electrified share — hybrids, plug-ins and EVs (xEV) | 35.3% | +11.9 points |
Company release, July 24, 2026. Consolidated basis.
Volume rose (+4.5%) and price per vehicle rose — average selling price ₩41.1m (about $30,500), up 7.9%. That produced the 12.6% revenue line, alongside a record 4.0% global market share.
Then the profit line went the other way. Working backward from the reported year-over-year change, the year-ago quarter’s operating profit was about ₩2.7639 trillion — so profit fell by roughly ₩135 billion while revenue grew by ₩3.7 trillion.
3. Where the money went — tariffs sit above the profit line
The cost ratio tells it plainly. Cost of sales was 81.7% of revenue, up 1.7 points. Excluding the tariff effect, it would have been 79.2% — a gap of about 2.5 points. In a business running an 8% operating margin, 2.5 points of cost ratio is not a rounding item.
In won, the headwinds behind that quarter looked like this (aggregated from the earnings materials):
| Operating-profit headwind | Amount |
|---|---|
| US tariffs (H1 2026 cumulative) | −₩783bn (~$582m) |
| Incentives and pricing | −₩723bn (~$537m) |
| FX warranty revaluation | −₩372bn |
| Product mix | −₩178bn |
⚠️ The ₩783bn tariff figure is a first-half cumulative number, while the ₩2.6285tn operating profit is a single quarter. Do not divide one by the other and call it a ratio. As a sense of scale only: an amount close to 30% of one quarter’s operating profit went out as tariffs over six months.
Incentives matter alongside it. On the earnings call the CFO said per-vehicle incentive spending rose $400 in the US and more than €1,000 in Western Europe year over year, adding that competing with Chinese EV makers in Europe was unavoidable and that the company would prioritize share over near-term EV profitability.
For a Korean automaker, a US tariff lands below revenue and above operating profit — the line where unit margin gets shaved even when volume holds. That structure is the same one we walked through in Hyundai’s US localization piece: building locally is a multi-year attempt to push that line down. Kia sits on the same line.
📌 Confidence label. The headline financials here are as released by the company, and the cost breakdown is aggregated from the earnings materials by third parties. This piece did not cross-check them against Kia’s filing with DART, Korea’s disclosure system.
US sales themselves held up — 224,000 units, +2.8%, with a 5.4% US market share, carried by the Telluride, Sportage and Sorento. The problem was never how many. It was how much was left per car.
4. What that leaves you buying — 6.8x earnings, ~5.5% yield
When the price stalls and earnings fall, the multiple does the math for you.
| Metric | Value | Basis |
|---|---|---|
| Share price | ₩124,200 (~$92.28) | Sept 14 close |
| EPS (trailing twelve months) | ₩18,178 (−17.8%) | aggregated, as of Sept 11 |
| P/E (trailing) | ~6.8x | our calculation |
| Forward P/E | ~5.9x | aggregated, as of Sept 11 |
| Market capitalization | ~₩48.27tn (~$35.9bn) | our calculation — 388.66m shares × Sept 14 close |
| Dividend yield | ~5.5% | our calculation — see below |
The dividend is the part that stands out. Kia paid ₩2.6425 trillion (about $1.96bn) for fiscal 2025, a 34.9% payout ratio. Divided across shares outstanding that is roughly ₩6,799 per share (about $5.05) — about 5.5% against the September 14 close.
Its sister company does it differently.
| FY2025 | Kia | Hyundai Motor |
|---|---|---|
| Total dividends | ₩2.6425tn | ₩2.6183tn |
| Payout ratio — share of profit paid out | 34.9% | 27.7% |
| Cash dividend yield | 4.2% | 1.9% |
| Primary return tool | Dividends | Buyback cancellation |
Korean press coverage, April 2026. “Cash dividend yield” here is the FY2025 figure measured on that year’s price — a different basis from the ~5.5% we calculate on today’s close.
Two reasons are given in Korean coverage: Kia’s core auto business throws off enough cash that dividends are treated as the natural return channel, and Hyundai Motor’s control of Kia is secure enough that Kia has little need to cancel shares to defend ownership.
Here is the reference point for a US reader: while Korea’s value-up push — the campaign to make listed companies return more to shareholders — keeps score in buybacks and share cancellations, Kia has been pressing the other button. Which is better is not this article’s call — but if you hold Kia, the return arrives as a dividend.
⚠️ That yield is fiscal 2025’s declared dividend measured against today’s price. The 2026 dividend was not obtained for this piece. It is a look-back, not a forecast.
5. What to watch next
Kia’s full-year 2026 guidance, as given: 3.35 million wholesale units, ₩10.2 trillion operating profit, 8.3% operating margin — issued with ₩783bn of first-half tariffs already in the numbers.
- FOMC, September 15–16. The statement lands at 3:00 AM Korean time; Seoul gets six hours before the KRX opens and trades it ahead of the US.
- Chuseok, September 24–25. With the weekend, four straight sessions dark in Seoul — while EWY keeps trading.
- Third-quarter results, late October. The question is whether tariffs keep arriving at first-half scale. The company did not give a Q3 or full-year tariff estimate, so neither will we.
- MSCI review, November 11. The day EWY’s holdings change mechanically — last time four names dropped out overnight.
Last week’s market context is in the weekly scoreboard.
6. Then why did the index run so hard?
That was Kia’s side. Here is the index’s side.
The KOSPI’s +58.62% does not mean Korea’s economy improved 59%. The KOSPI is capitalization-weighted, and the holdings of EWY — the Korea ETF most US investors actually use — show the shape immediately.
| EWY holding | Weight |
|---|---|
| SK Hynix | 24.16% |
| Samsung Electronics | 21.96% |
| Top two chipmakers | 46.12% |
| Hyundai 1.62% + Kia 1.08% + Hyundai Mobis 0.92% | 3.62% |
iShares disclosure, as of September 11, 2026. Net assets $28.58bn, 78 holdings, benchmark MSCI Korea 25/50.
The top two are 12.7x the three automakers combined; SK Hynix on its own is 6.7x. We took that concentration apart in the EWY concentration piece.
Both things are true at once. Kia took a tariff hit on its own income statement, and Kia is 1.08% of the index that defines “Korea” for most US investors. Neither fact explains the other. You need both.
7. One more number — and why you must not subtract it
- KOSPI year to date: +58.62% — won · KRX closes · price index · as of September 14
- EWY NAV total return year to date: +88.52% — dollars · MSCI Korea 25/50 (a capped index — no holding above 25%, and those above 5% capped at 50% combined) · total return, dividends reinvested · as of September 10
⚠️ Do not subtract these. Four things differ at once — currency, index, return definition, and as-of date (September 10 versus September 14, and the KOSPI fell 3.26% on September 14 alone). Any gap you compute blends four differences into one meaningless number.
So we put the two side by side under their labels and stop there. Attributing the difference to concentration, or to anything else, without decomposing those four variables would be a guess, not a finding.
8. How to get exposure
- 🟢 EWY (NYSE Arca) — 1.08% exposure to Kia, tradable in any US brokerage account. It also means 46% exposure to two chipmakers in the same purchase.
- ⚪ KRX 000270 — requires a Korean account. The ~5.5% dividend only arrives in full through this route (foreign withholding is a separate matter).
- 🔴 Direct US listing — we could not find a liquid US over-the-counter route for Kia. And do not substitute Hyundai Motor’s OTC ticker for Kia. Different company, and that ticker is unsponsored over-the-counter stock, not an ADR — no bank stands behind it, and liquidity can be thin.
In practice, the realistic US route to Kia today is the 1.08% inside EWY.
9. An anchor for US readers
Think of a US automaker in a stretch where revenue climbs and margin compresses: burn incentives to defend volume, and the top and bottom of the income statement move in opposite directions. Reading a sales record and assuming a profit record goes with it is the mistake.
Not a perfect parallel — two differences.
- US margin pressure is mostly incentives and labor. Kia carries an external policy line on top of that — tariffs alone accounting for about 2.5 points of cost ratio, which is not a variable that management controls.
- Trading at 6.8x earnings with a ~5.5% yield is a different valuation regime than US peers see. The same business is not being priced the same way.

The takeaway
Record revenue, operating profit down 4.9%, margin at 8.0% — tariffs took ₩783bn in the first half and incentives ₩723bn. So the stock is up 1.97% this year while the KOSPI is up 58.62%.
🎩 Under the Gat — Kia sold more cars than it ever has, and wrote Washington a bill for the privilege. The stock did not stall because the company failed; it stalled because the part that worked went out as tariffs — and the market priced what was left at 6.8x. Buying a country ETF is not buying a country. It is buying that country’s market-cap distribution, and Korea’s is tilted hard toward semiconductors. Kia sits on the other side of the tilt.
This piece does not say Kia is cheap or expensive. It says something narrower: “I invested in Korea” does not tell you what you are holding. An income statement and a holdings table do. Both take about five minutes.
FAQ
Revenue was a record — why did operating profit fall?
Costs rose faster than revenue. Cost of sales reached 81.7% of revenue, but excluding tariffs it would have been 79.2%. In won, US tariffs were ₩783bn cumulative in the first half and incentive and pricing pressure another ₩723bn.
Is Kia’s dividend yield really above 5%?
Fiscal 2025 dividends of ₩2.6425 trillion across shares outstanding work out to roughly ₩6,799 per share, which is about 5.5% against the September 14 close of ₩124,200. That is last year’s declared dividend measured against today’s price. The 2026 dividend was not obtained for this piece.
Do Hyundai and Kia return capital differently?
Yes. For fiscal 2025 Hyundai Motor ran a 27.7% payout ratio and leans on buyback cancellation; Kia ran 34.9% and leans on dividends.
Is Kia in EWY?
Yes — 1.08%, the 15th largest holding, classified Consumer Discretionary, per the iShares disclosure as of September 11, 2026.
How can the KOSPI rise 59% while Kia rises 2%?
The KOSPI is capitalization-weighted, and on EWY’s basis SK Hynix and Samsung Electronics alone are 46.12%. Heavily weighted names carry the index; lightly weighted ones neither move it nor get carried by it. Kia also had the tariff and margin problem described above.
Why is EWY’s +88.52% different from the KOSPI’s +58.62%?
Four things differ — currency (dollars versus won), index (MSCI Korea 25/50 versus KOSPI), return definition (NAV total return versus price index), and as-of date (September 10 versus September 14). Because all four differ, the two numbers must not be subtracted.
Why did Korean stocks fall today?
This piece did not confirm a cause from a primary source, so it does not name one. The Fed’s FOMC meeting on September 15–16 is a published calendar fact.
Sources
- Kia Q2 2026 results (revenue, operating profit, operating margin, net profit, wholesale units, xEV mix): company release, July 24, 2026, consolidated basis.
- Cost breakdown (tariffs, incentives, FX warranty, mix), average selling price, market share and full-year guidance: aggregated from the Q2 2026 earnings materials by third parties.
- Cost-of-sales tariff effect, per-vehicle incentive increases, CFO remarks, US unit sales: press coverage of the earnings call.
- EPS, shares outstanding and forward P/E: third-party aggregation, as of September 11, 2026. Trailing P/E, market capitalization, dividend per share and dividend yield on the September 14 close are our own calculations from those inputs.
- FY2025 dividends, payout ratios and the Hyundai comparison: Korean press coverage, April 2026.
- Index and single-stock closes: market data queried directly (^KS11, ^KQ11, 000270.KS, 005380.KS) — KRW · KSC · Asia/Seoul — vendor tags, not exchange-published attestations. Daily moves re-verified against the September 11 close and year-to-date moves against the December 30, 2025 close, by multiplication check.
- EWY holdings and fund metrics: iShares product-page disclosure, as of September 11, 2026.
- FX: all won-to-dollar conversions use a single basis, ₩1,345.9 (Seoul 3:30 PM, September 11). The September 14 rate was not obtained.
- ⚠️ The financial figures in this article are company-released and third-party aggregated. They were not cross-checked against Kia’s DART filing (Korea’s disclosure system).
- Not obtained and therefore not discussed: Q3 or full-year tariff guidance · the 2026 dividend · September 14 by-investor flows · the cause of the September 14 decline · liquidity of any US OTC line for Kia.
Not financial advice. This article is for information only. TheGatBull and its author hold no position in the securities mentioned unless disclosed. Confidence labels are as of publication.